BiclustGUI 1.1.1: BiBit Workflow for Noisy Biclusters
Ewoud De Troyer, University of Hasselt (CenStat)
Introduction - 1.1.1 Update
The 1.1.1 update of the BiclustGUI introduces two 2 new features:
- The BiBit Workflow Tool for BiBit results: Discover noisy biclusters from larger column patterns
- The Jaccard Index Heatmap tool: Create a Jaccard Index heatmap of the biclusters of a single result or compare the biclusters of two results.
Installation Instructions
setRepositories(ind=c(1:5))
install.packages("RcmdrPlugin.BiclustGUI")
BiBit Workflow - Overview
This workflow continues further on an earlier blog post on the BiBit algorithm with noise allowance. An accompanying illustration of the algorithm can be found here.
Looking for Noisy Biclusters in large binary data using BiBit with noise allowance often results in many (overlapping) biclusters. In order decrease the number of biclusters and find larger meaningful patterns which make up noisy biclusters, the following workflow, namely BiBit Workflow, can be applied. Note that this workflow is primarily used for data where there are many more rows (e.g. patients) than columns (e.g. symptoms). For example the workflow would discover larger meaningful symptom patterns which, conditioned on the allowed noise/zeros, subsets of the patients share.
The workflow follows the following steps:
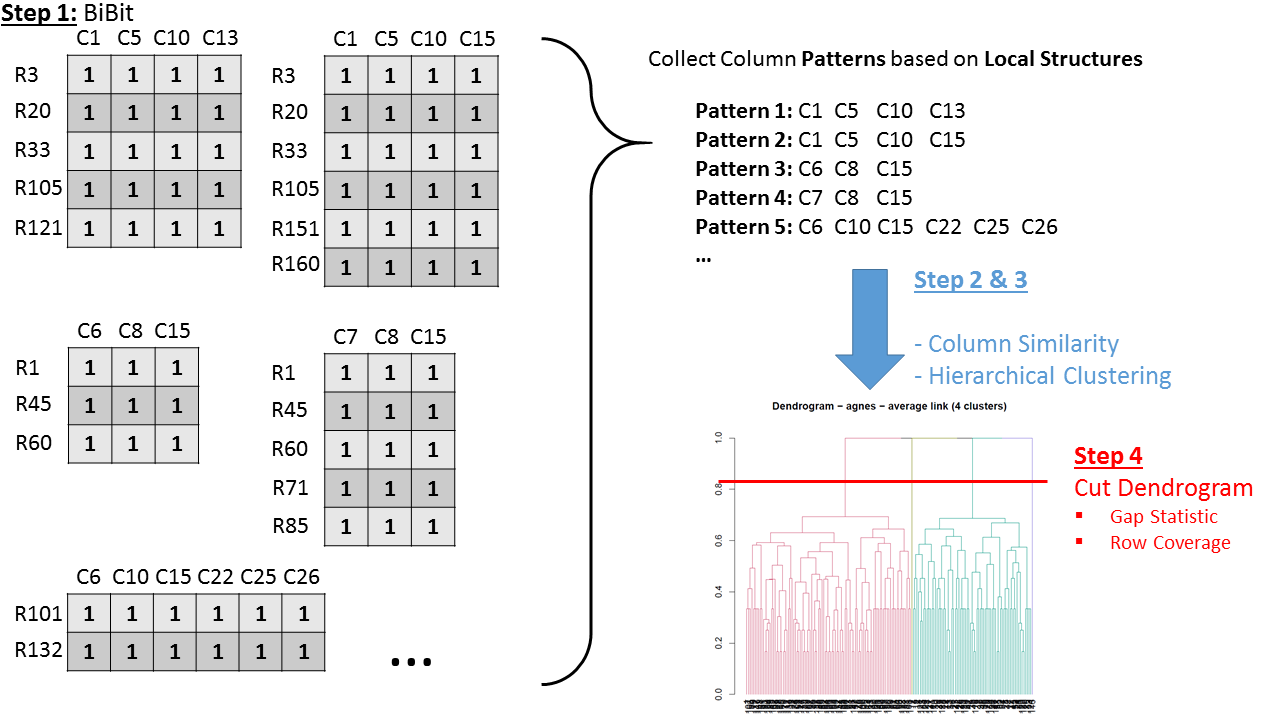
- Apply BiBit with no noise (preferably with high enough minimum rows and columns)
- Compute the Similarity Matrix (Jaccard Index) of all biclusters. It is recommended to base this similarity only on the column dimension. The reason being that in this step we are primarily interested in finding larger column patterns based on local substructures in the data. The matching rows to these patterns are discovered in a later step.
- Apply Agglomerative Hierachical Clustering on the Similarity Matrix (average link by default).
- Cut the dendrogram of the clustering result and merge the biclusters based on this decision. (e.g. gap statistic, row coverage)
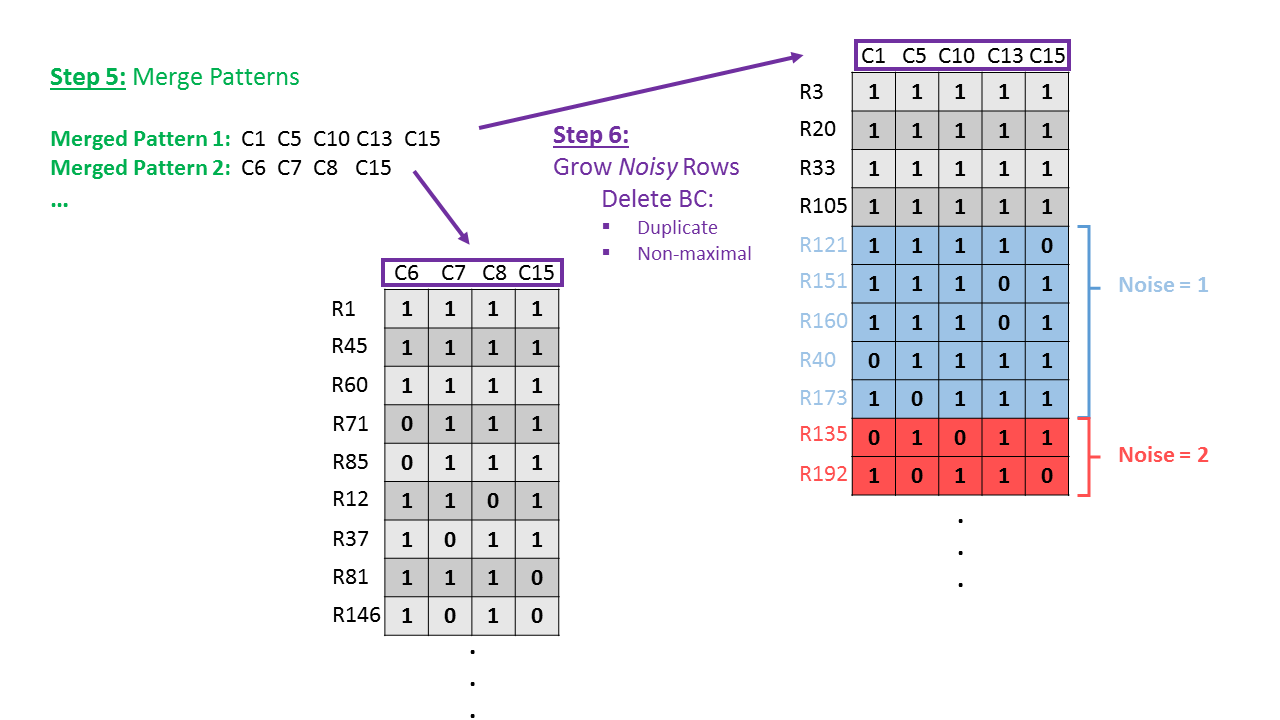
- Extract the column memberships of the merged biclusters. These are called the Merged Patterns.
- Starting from these new patterns, noisy rows are grown to create a final number of biclusters. Finally duplicate and non-maximal biclusters are deleted.
A schematic of the workflow steps:
BiBit Workflow - Schematic (Step 1-4)
BiBit Workflow - Schematic (Step 5-6)
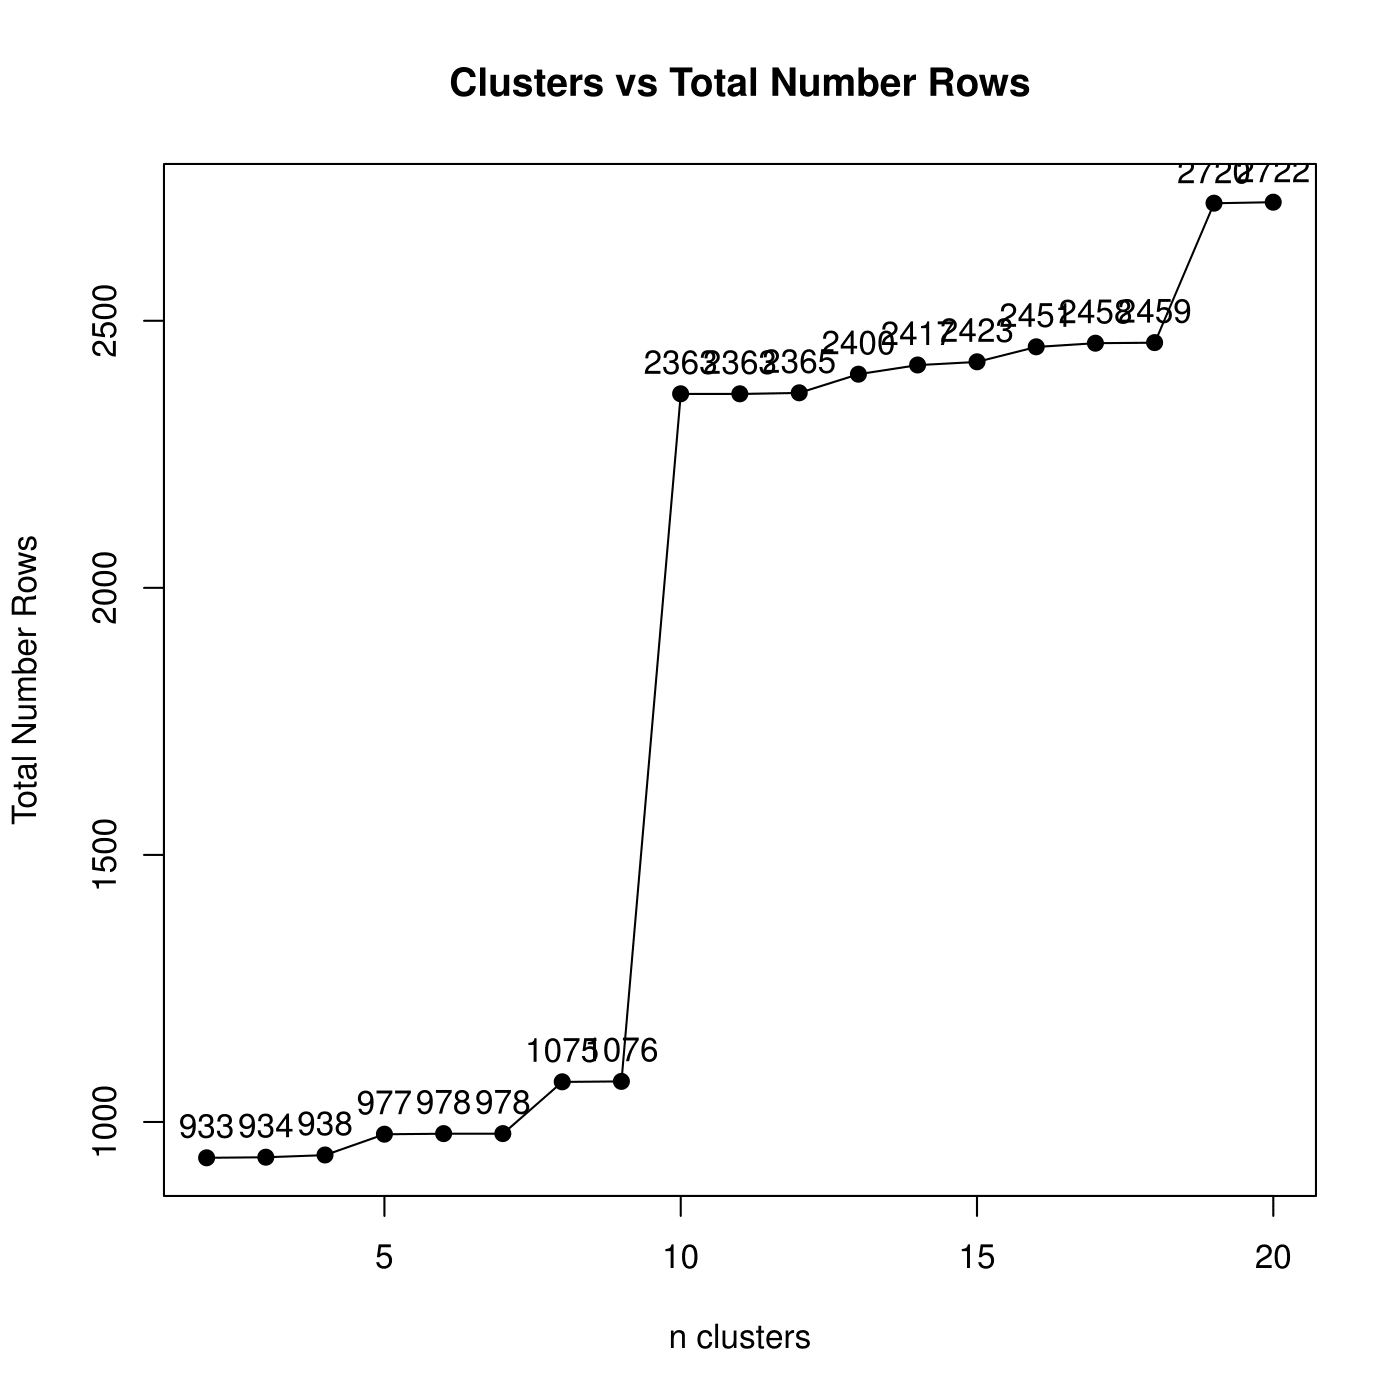
An informative plot that can aid in the choice of number of clusters in Step 4 is the Row Coverage plot. It plots the number of clusters versus the total number of unique rows (after merging the column patterns and growing rows to create biclusters). The more clusters you choose, the smaller (albeit more similar) the patterns are and the more rows will fit your patterns (i.e. more row coverage).
Row Coverage Example
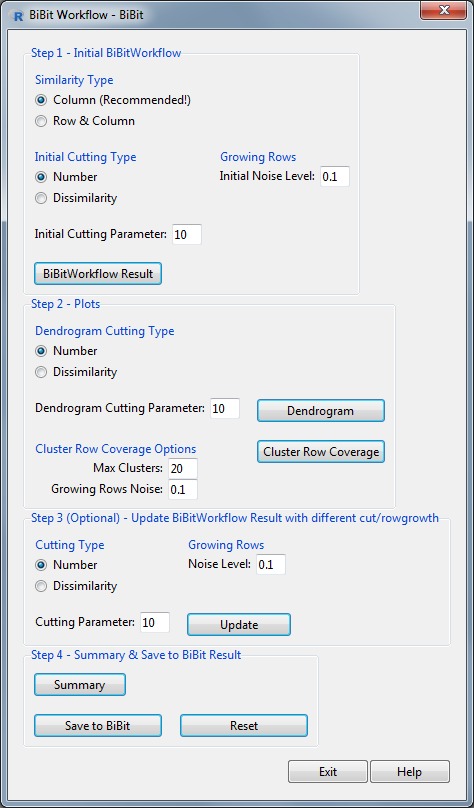
The default version of the workflow has been included in the BiclustGUI. It can be accessed through the BiBitWorkflow button the Plots & Diagnostics tab of the BiBit window. The earlier obtained BiBit result (from the Clustering Tab) will be used in the BiBit Workflow.
BiBit Workflow Window
The main steps in this window are:
- Apply the default BiBit Workflow (using average link) with choice of similarity, cutting parameter and noise level.
- Visualise the Dendrogram and Cluster Row Coverage graphs.
- Update the BiBit Workflow result with new cutting and noise parameters.
- Save the BiBit Workflow result to a BiBit result in order to use all available visual and diagnostic tools in the BiclustGUI. (e.g. The noise column graph for a BC which tells you which column/condition in the pattern most often absent (i.e. noisy))
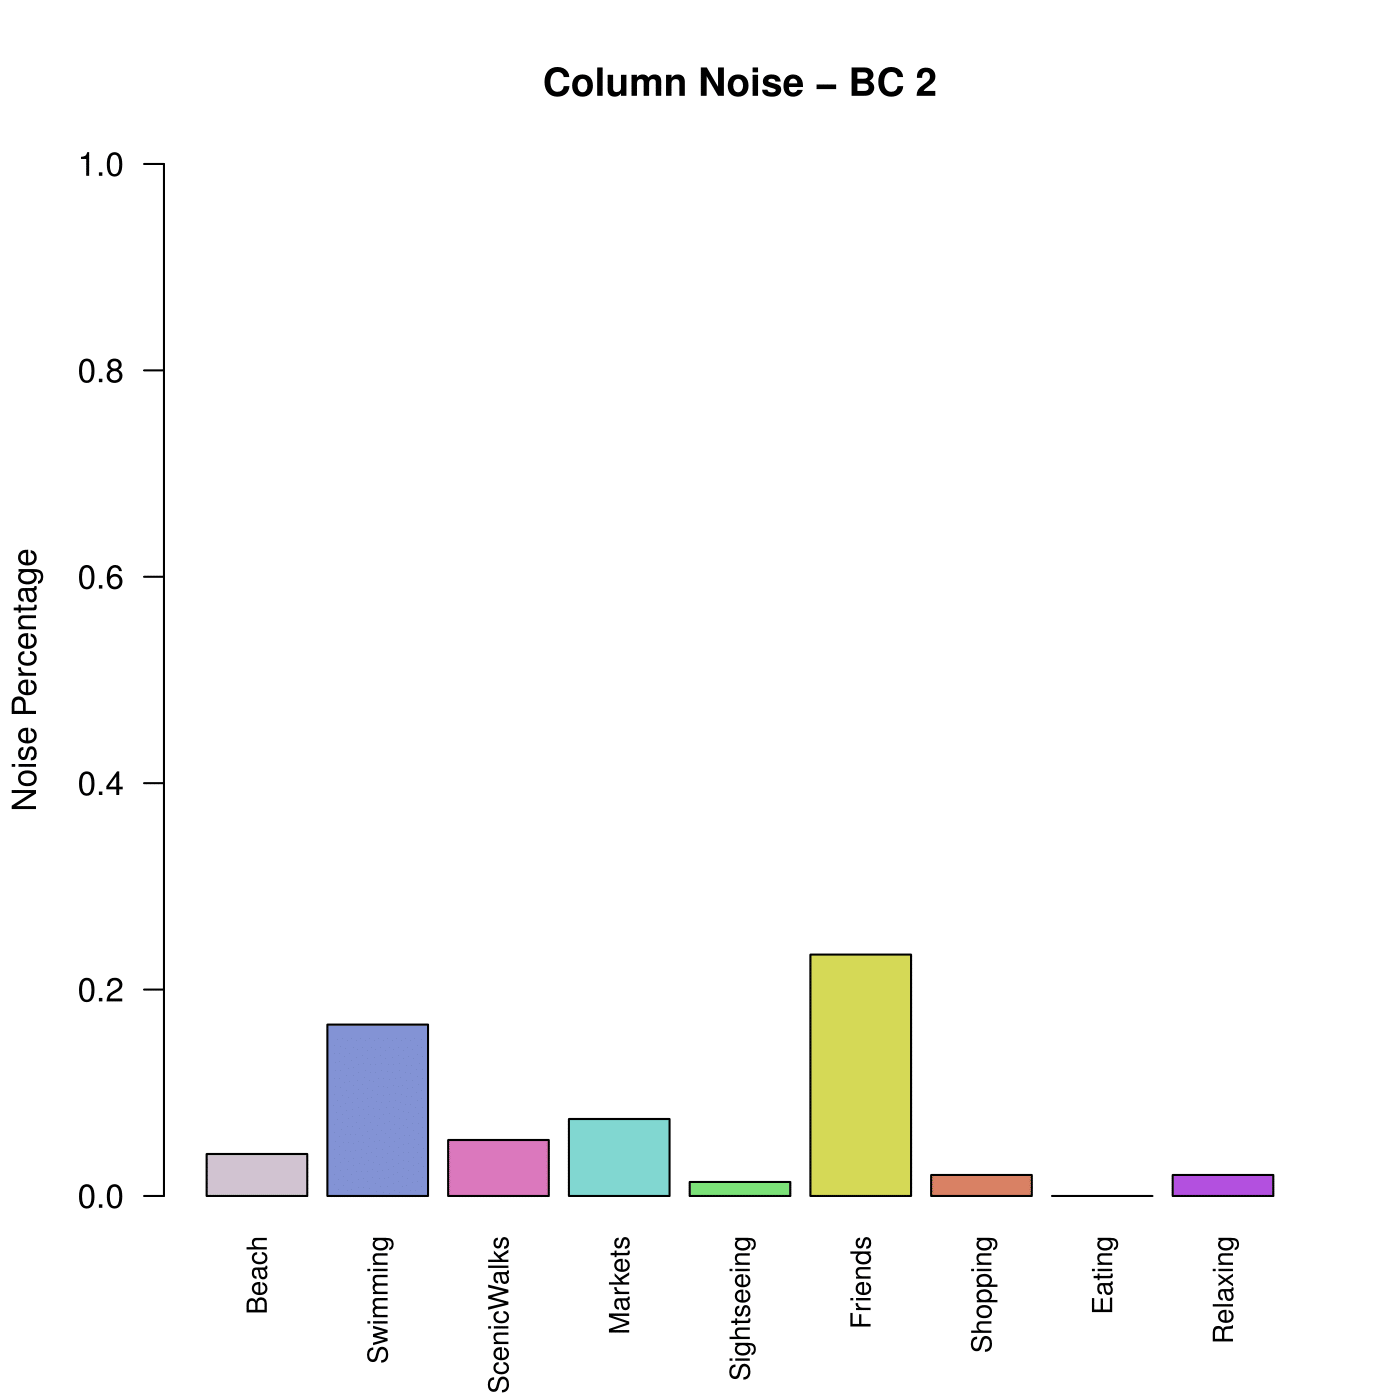
Column Noise Example
A more detailed description can be found in the vignette. Note that a more exhaustive analysis (including the use of the Gap Statistic) can be applied by using the functions of the BiBitR (CRAN, GitHub) package directly.
Additional New Feature: Jaccard Index Heatmaps
An extra utility tool has been added to the BiclustGUI. With it you can either plot a heatmap of the Jaccard Index between the biclusters of a single result or plot a heatmap between the biclusters of two different results.
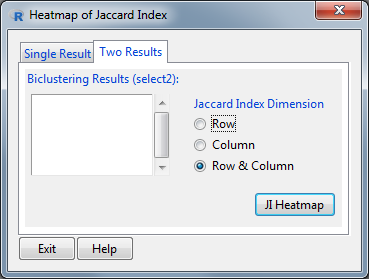
Jaccard Index Heatmap Window
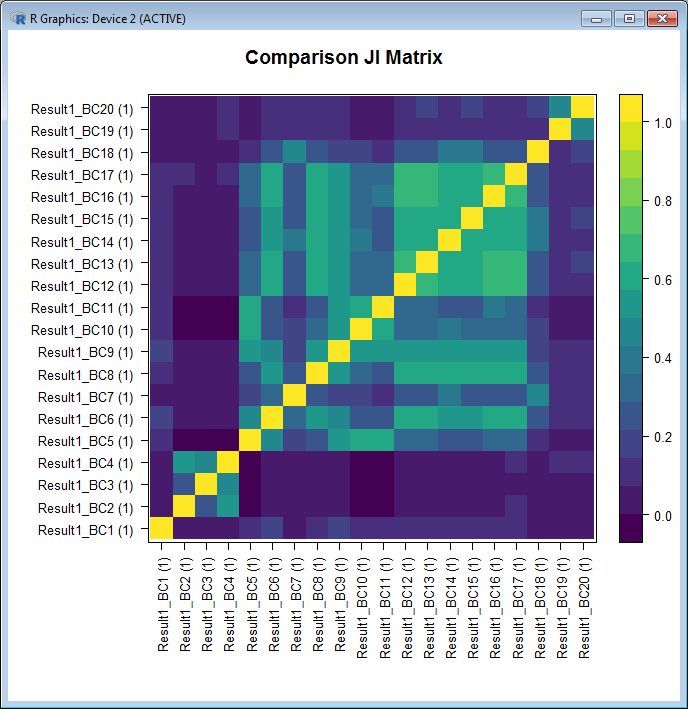
Jaccard Index Heatmap Example
Contact
Please direct any questions/suggestions/bugs to ewoud.detroyer[at]uhasselt.be.
We are happy to take any feedback!